

DéveloppementGitHub Blog
Développement
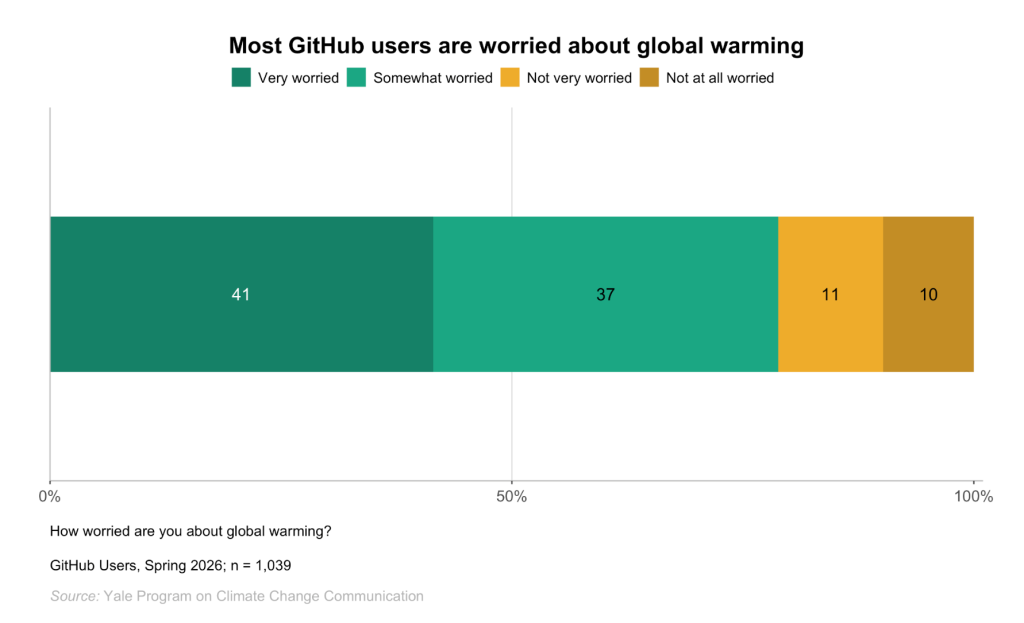

New research from GitHub and Yale Program on Climate Change Communication finds strong demand for tools, measurement, and practical guidance that can help developers reduce wasted compute. The post Developers want more efficient software.…

Google has added a Kernel Profiling suite to XProf. This is its open-source profiler for TPU workloads. Now, developers can see cycle-level details in custom Pallas kernels. Before, these kernels appeared as single opaque blocks in trace…

Ryan chats with the GM of Slack, Rob Seaman, about how their new Code Channels feature is bringing multiplayer AI to your team chats.
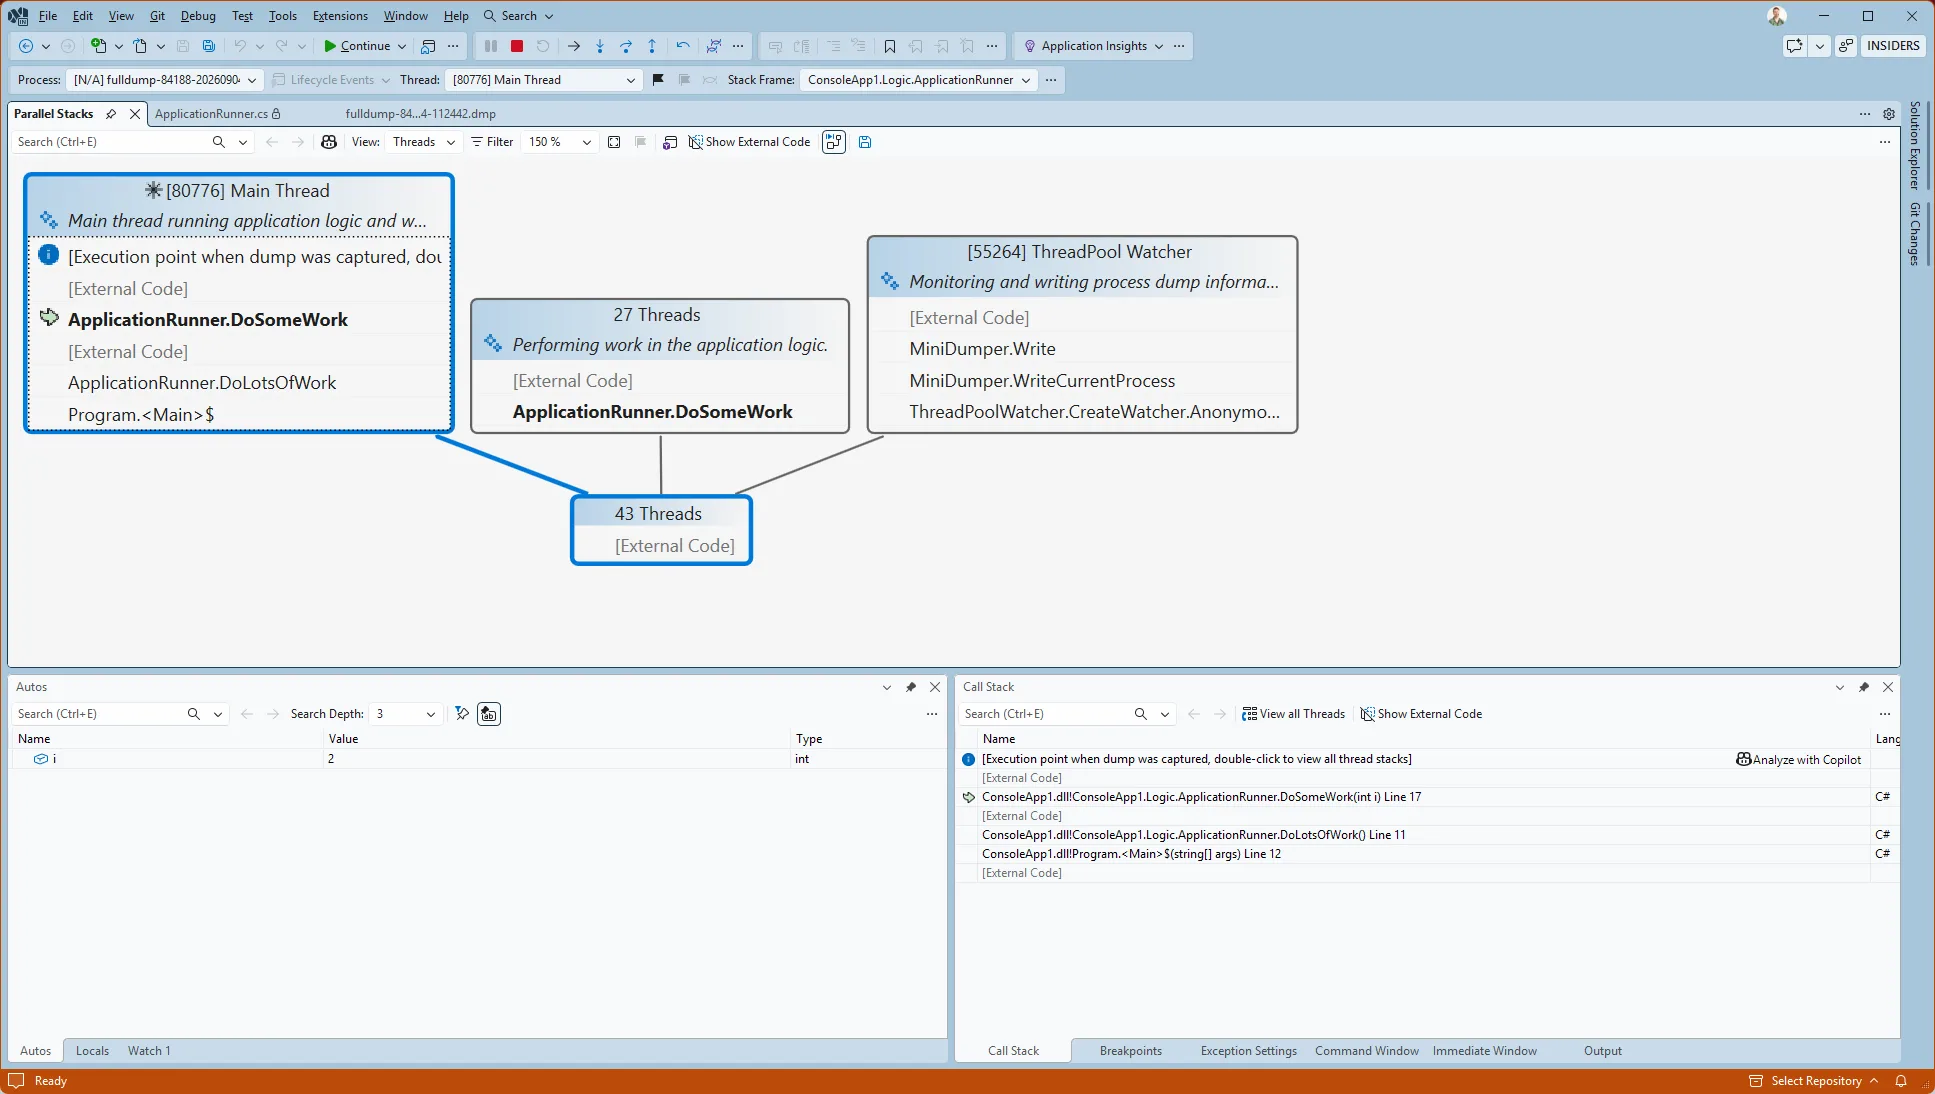
Learn how to create a memory dump in C# to capture the state of your application for debugging purposes. The post Creating a memory dump in C# appeared first on .NET Blog.